Happy Halloween. This is a ghost story about three things that haunt a home: the power your house uses when nobody's home, what light costs, and the electric car that nearly won in 1900. Every number comes with its working, so you can redo it with your own figures. Our house is in New Zealand (NZ$), with notes for other countries where they differ.
The short version
- Our 3 am: between 1 and 5 am, with the car not charging, our house draws about 350 W on a typical night and never much below 225 W. That is about 2,000 kWh, a bit over NZ$430, a year at the 22c overnight rate. On most nights our battery covers it.
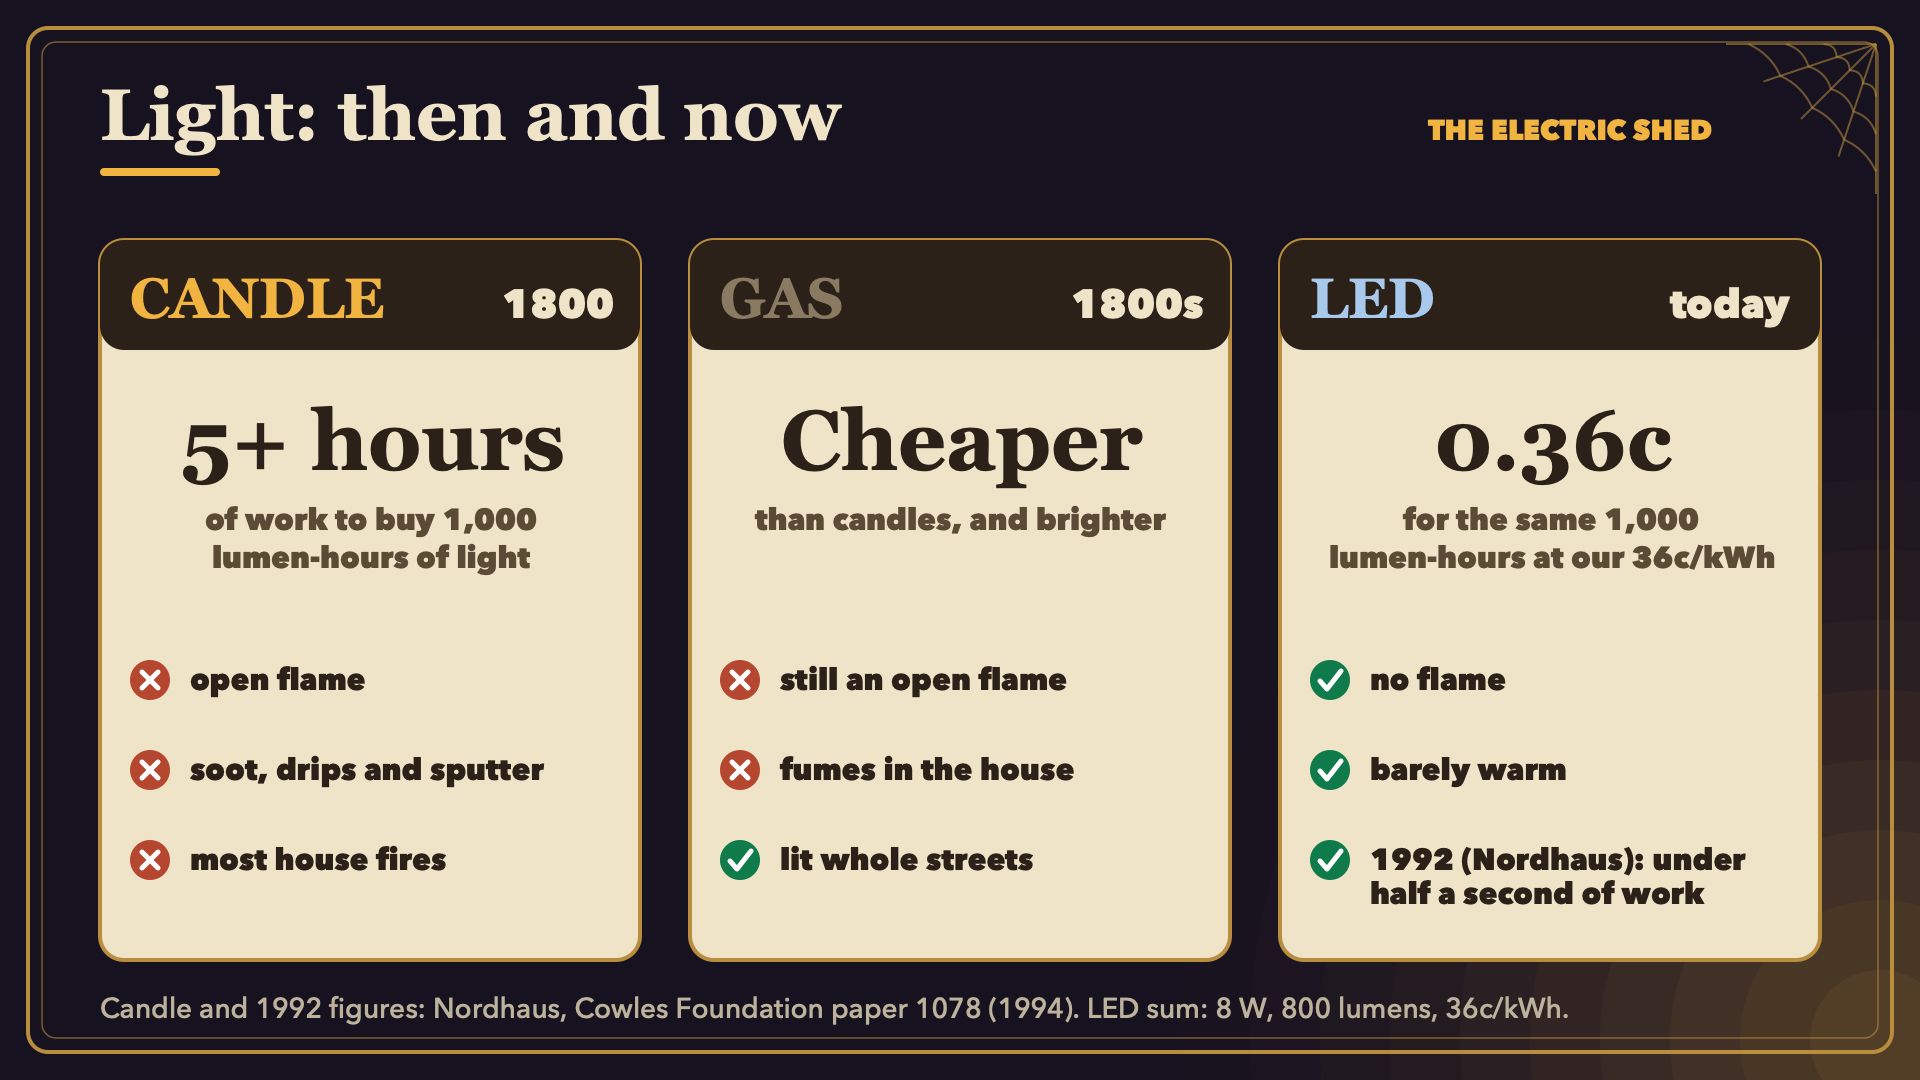
- Light: one bright 8 W LED bulb gives about 1,000 lumen-hours in 1.25 hours. At our 36c/kWh, that costs about 0.36c. In 1800, economist William Nordhaus found, the same light took more than five hours of work (check the paper for the exact figure).
- The 1900 electric car: of the 4,192 cars made in the U.S. in 1900, 1,575 (38%) were electric, 1,681 steam and 936 petrol. Petrol took the lead around 1903.
- Typical standby is 5–10% of a home's electricity. Each watt left on all year is 8.76 kWh, about NZ$2–3.
Haunting one: the ghost in our house
Our house draws power all night. Between 1 and 5 am, over 31 nights from 22 September to 21 October, with the car not charging:
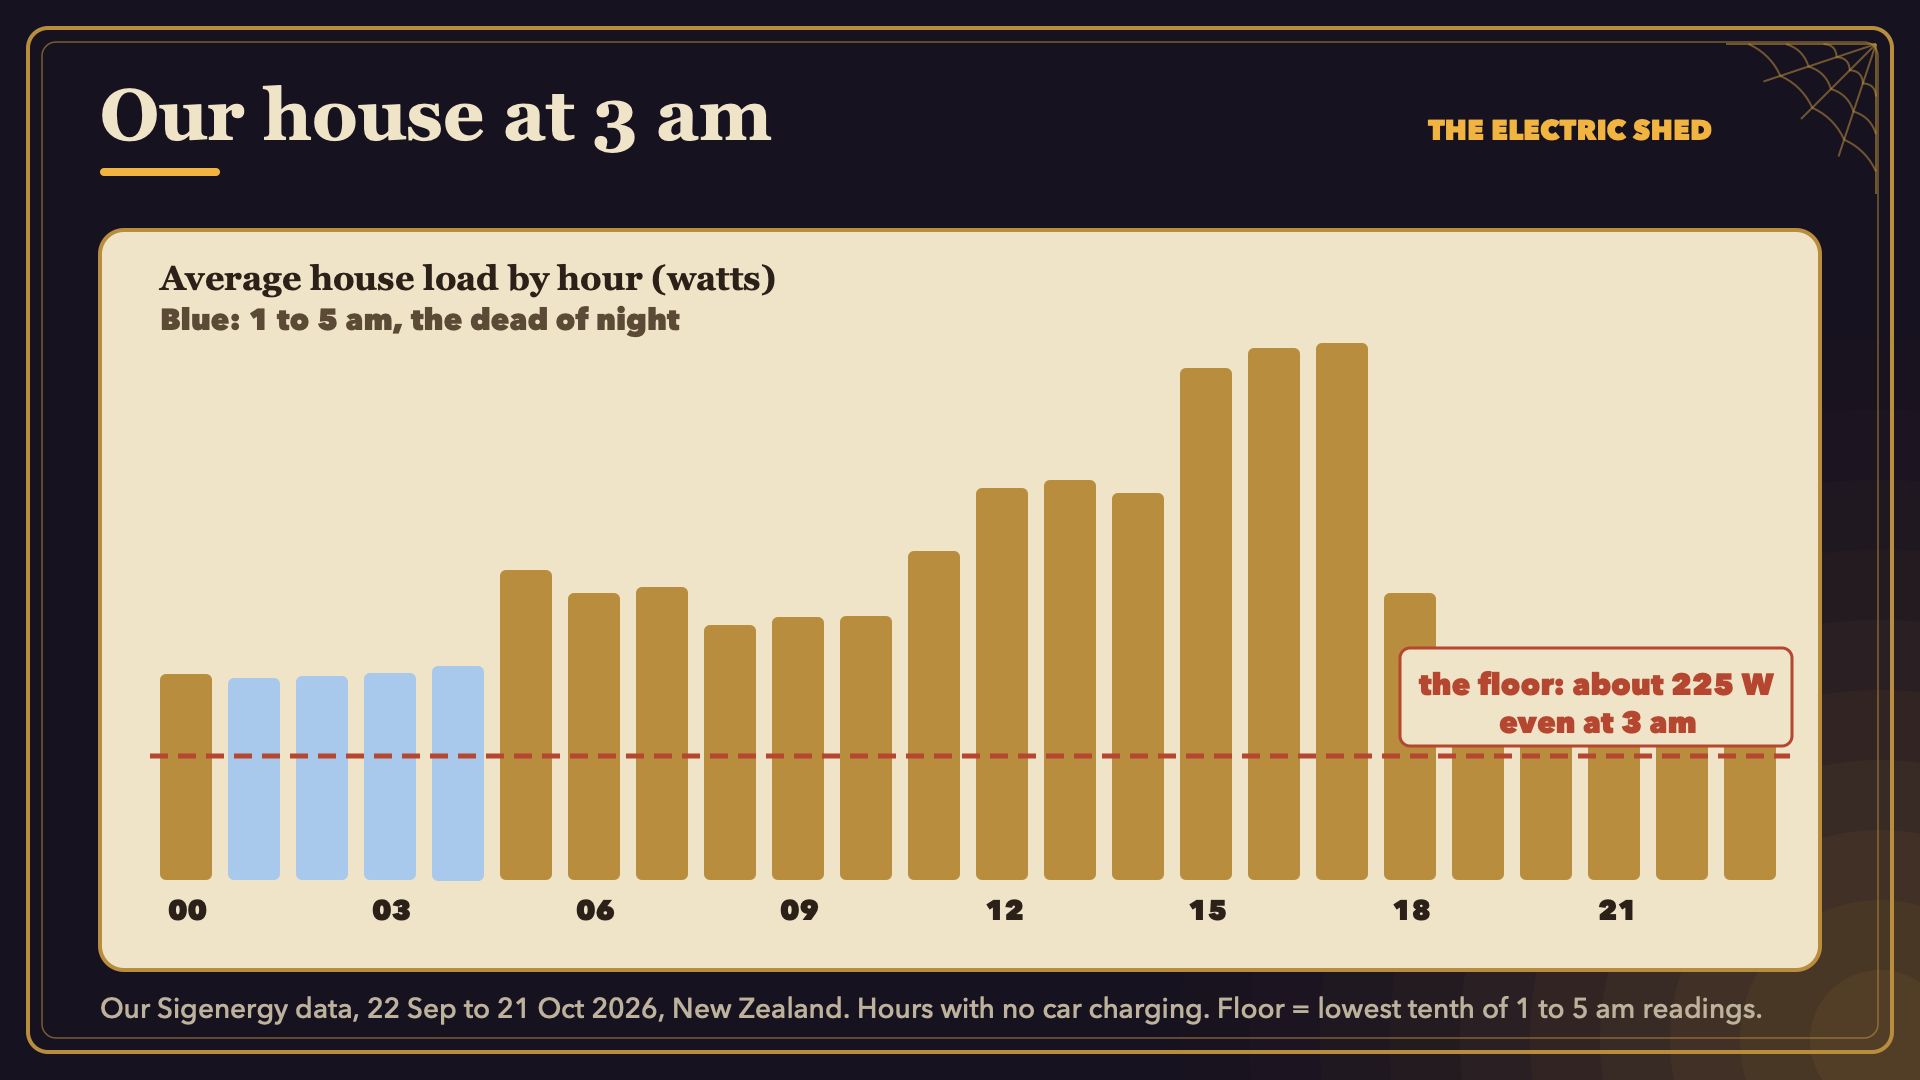
- The middle night is about 350 W (nightly range 279–434 W).
- The floor, the lowest tenth of readings, is about 225 W.
- A year of it: 225 W × 8,760 h ÷ 1,000 = 1,971 kWh, or about 2,000 kWh, a bit over NZ$430 at the 22c overnight rate.
- Who pays: on most nights (25 of 30) our battery covers it, running the fridge and router on solar stored during the day. We don't buy that power, but it's power we could have sold at 14c. Without a battery, you'd pay for all of it.
That is a floor, not a bill: it assumes the floor holds all day, and the house uses more in the daytime.
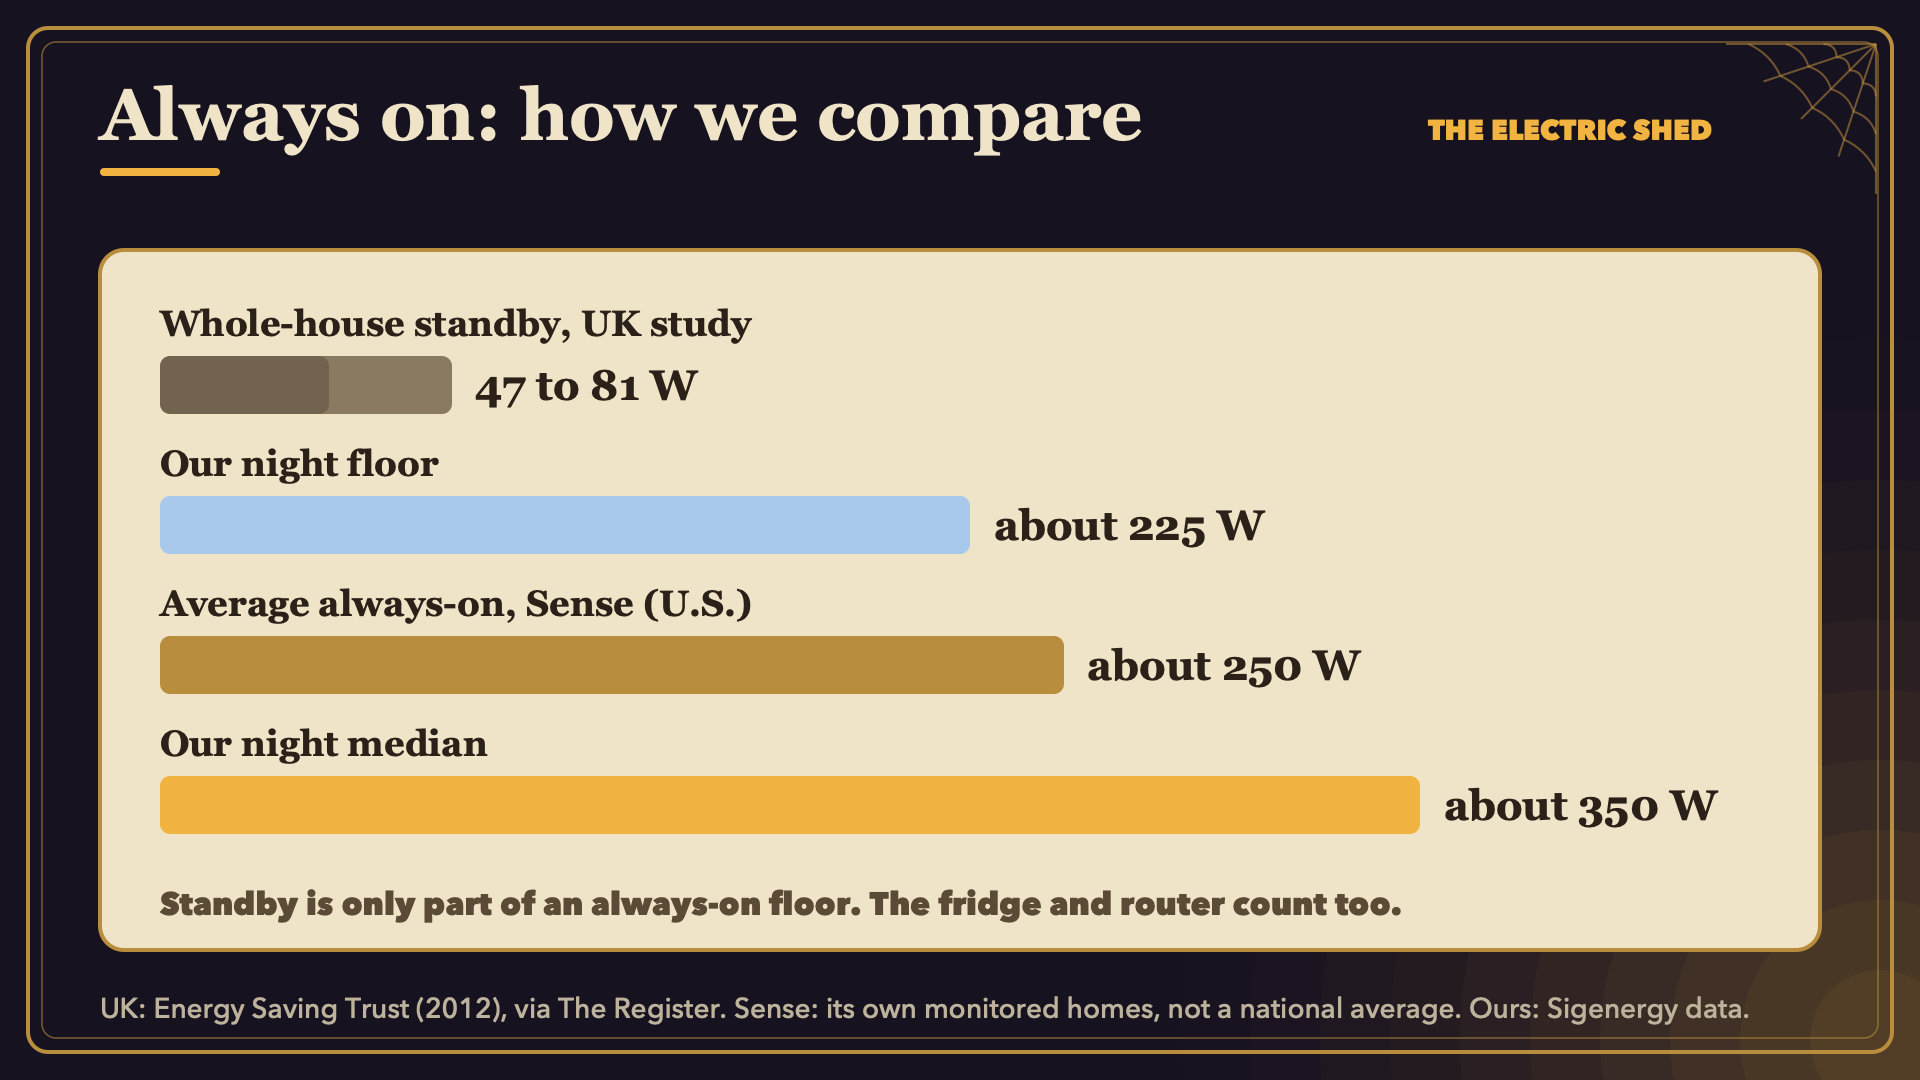
Is that scary? Not really. The usual estimate for standby power is 5–10% of a home's electricity. The average New Zealand home uses about 7,084 kWh a year (MBIE), so that is roughly 350–700 kWh. Studies elsewhere found whole-house standby of 47–81 W (UK, Energy Saving Trust, 2012). An American monitoring company, Sense, says its average home has about 250 W always on. Our floor is higher because it isn't only standby: it's the fridge, the router, the little red lights, and the inverter and battery too. So we're normal.
The usual vampires
Most of them come down to one setting.
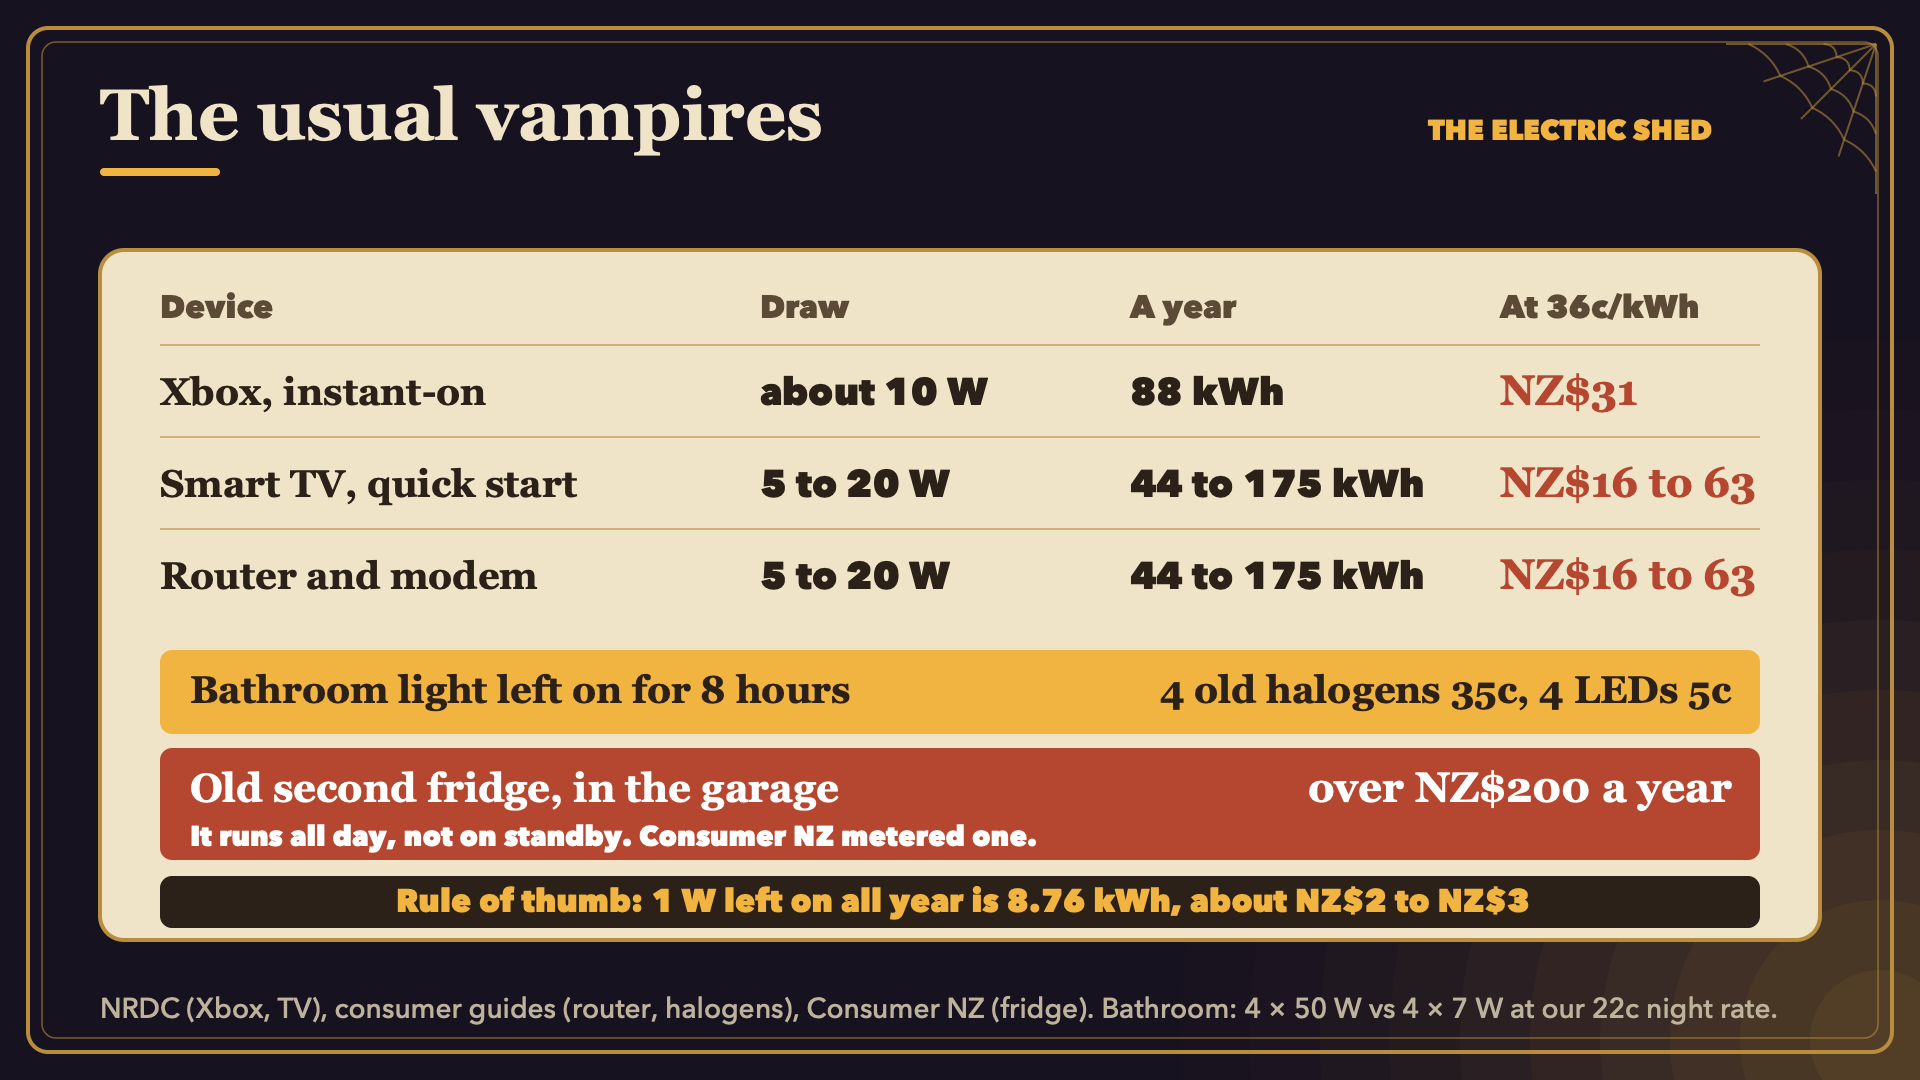
- Xbox Series X on instant-on: about 9–13 W all day, against under 1 W on the energy-saving setting (NRDC; The Verge; AnandTech). At 10 W, that is 88 kWh, about NZ$31 a year.
- Smart TV on quick start: 5–20 W in NRDC's 2015 study (13 W on average, up to 37 W in some). New ENERGY STAR sets use under 1 W in standby.
- Router and modem: commonly 5–20 W, and they should stay on.
- The bathroom light left on overnight: it depends what's in the ceiling. Four old 50 W halogen downlights for 8 hours use 1.6 kWh, about 35c at our 22c overnight rate. Four LED downlights of about 7 W use 0.22 kWh, about 5c. (Typical figures from retailers; check your own fittings.)
- The old second fridge in the garage: not a standby load at all. Consumer NZ put a meter on one and found it cost over NZ$200 a year. If it only keeps a few drinks cold, it is an expensive drink.
The rule of thumb: one watt left on all year is 8.76 kWh, about NZ$1.90 at 22c or NZ$3.15 at 36c. A 10 W Xbox is about NZ$31 a year to do nothing. Switch off what you can, and don't lose sleep over the rest.
Other countries: the sum is the same, only the price changes. At roughly A$0.30, £0.25 or US$0.17 a kWh, one watt all year costs about A$2.60, £2.20 or US$1.50 (check your own rate).
Haunting two: an hour of light
When light meant candles, buying it took real work. William Nordhaus, in a 1994 Cowles Foundation paper, built a "true price" of light back through candles, whale oil, gas and electric bulbs. His headline is that official price indexes miss the fall in the cost of light by a factor of between 900 and 1,600 since 1800.
Here is the modern end of the sum:
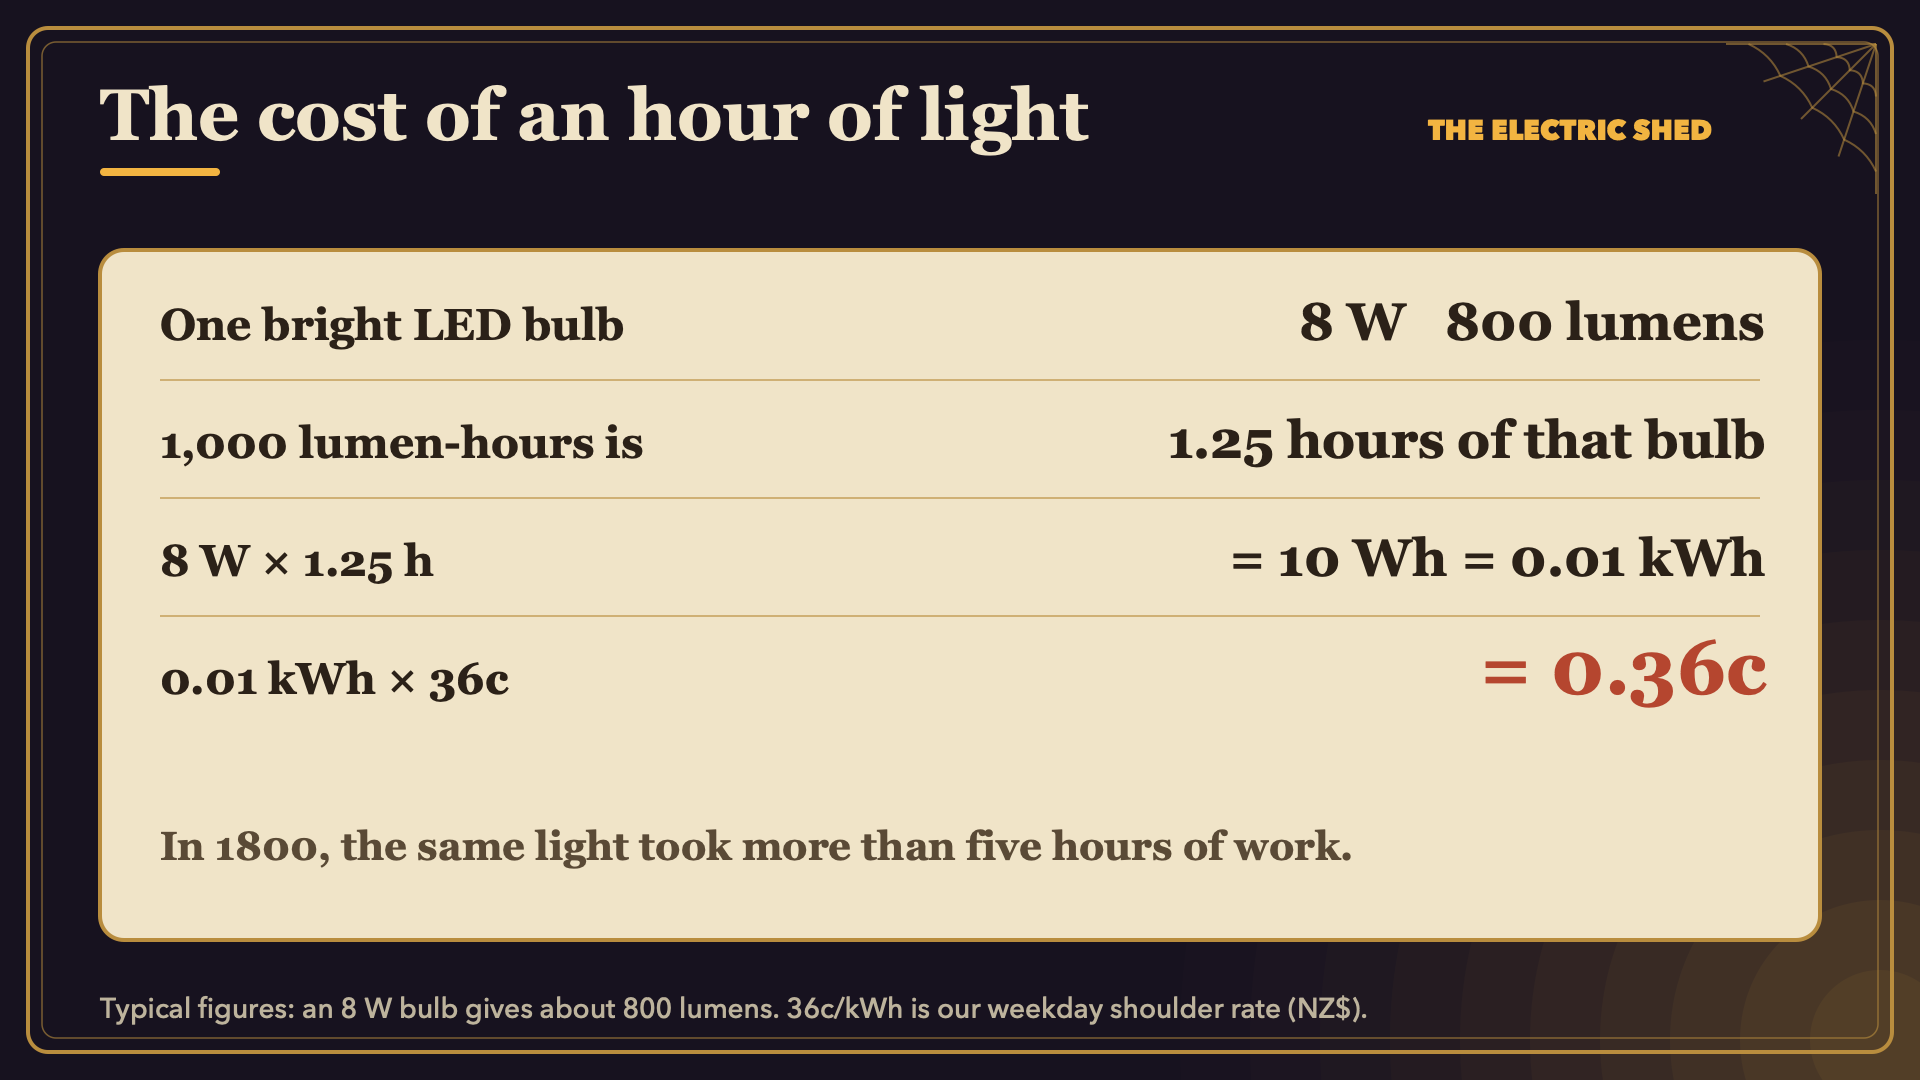
- Bulb: about 8 W and 800 lumens (typical).
- Time: 1,000 lumen-hours ÷ 800 lumens = 1.25 hours.
- Energy: 8 W × 1.25 h = 10 Wh = 0.01 kWh.
- Cost: 0.01 kWh × 36c = 0.36c.
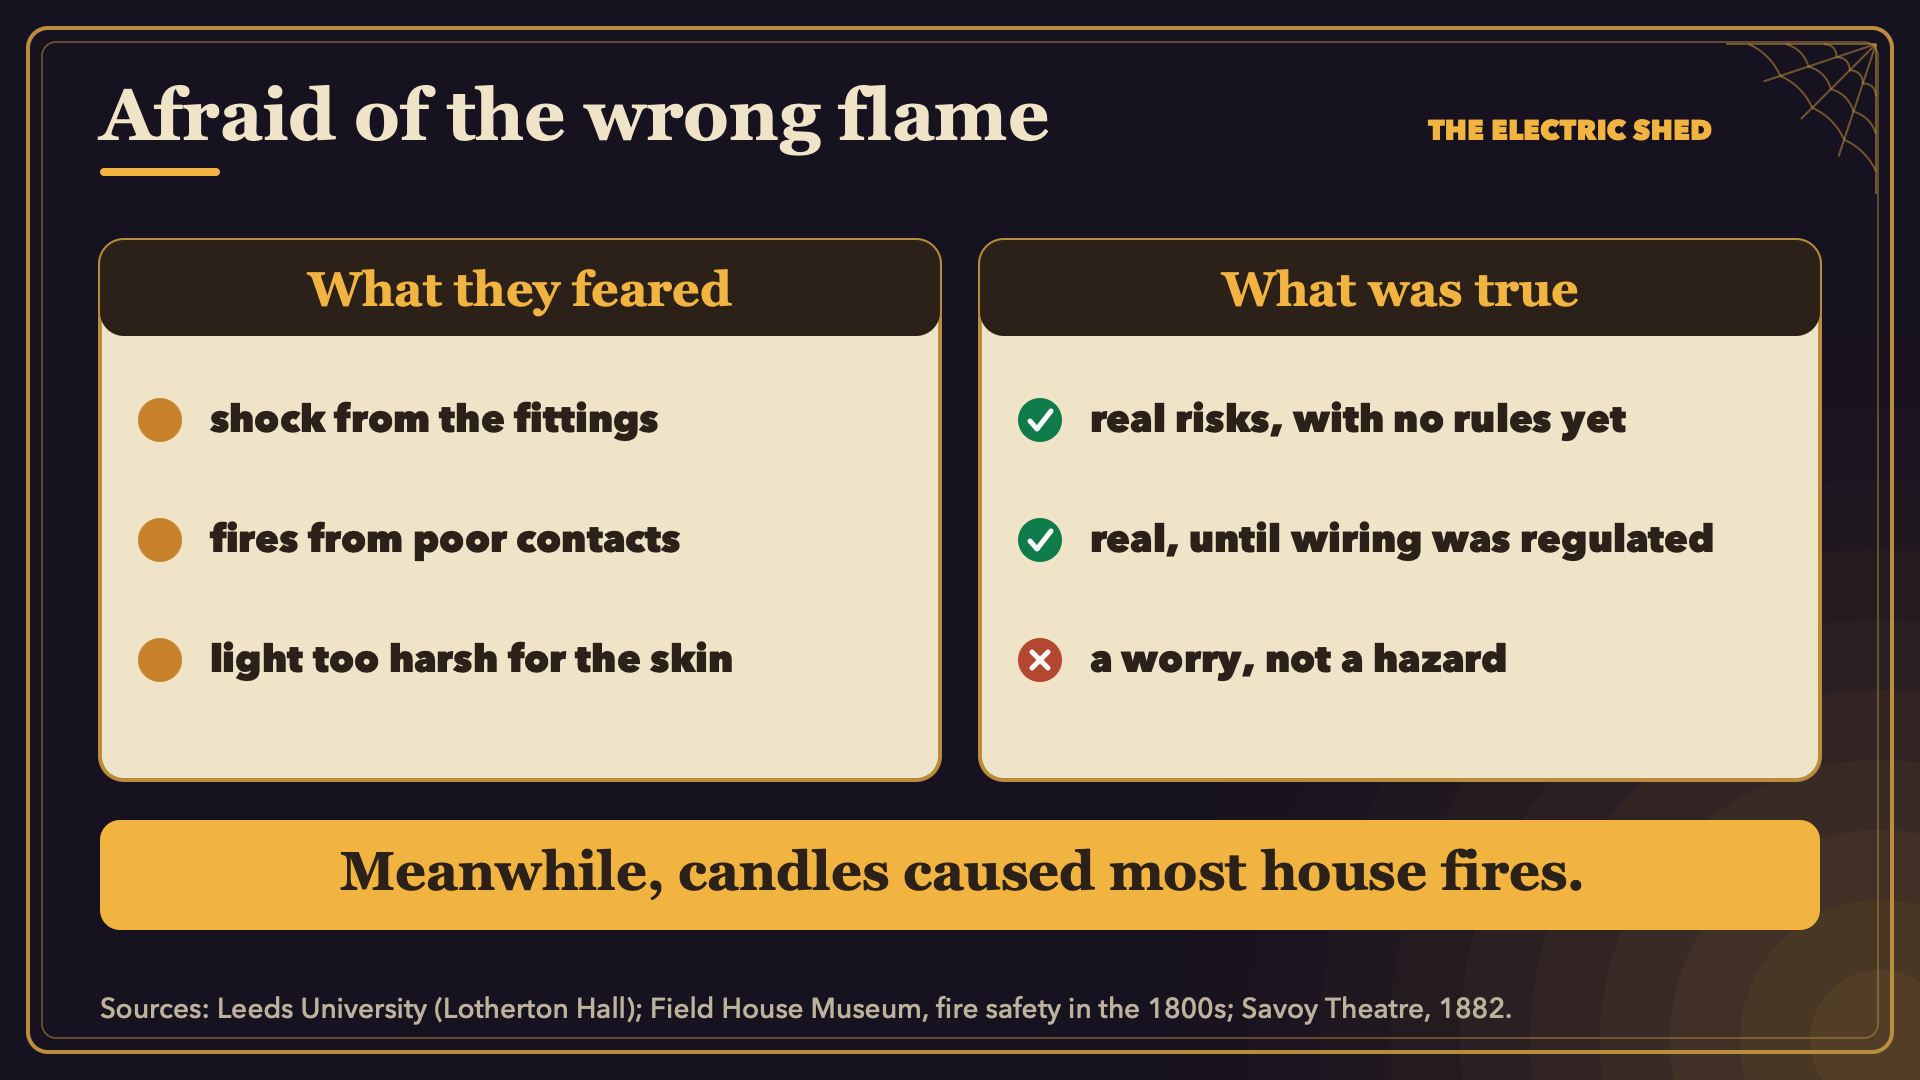
Gas was cheaper and brighter than candles, but it was still an open flame in a house full of curtains. The Victorians were also wary of the new electric light. Early wiring could shock or start fires, from poor contacts and hot lamps, and there were no rules yet. Yet candles caused most house fires, and when London's Savoy Theatre went electric, an 1882 inspection judged it absolutely safe because the light didn't heat the air the way gas did.
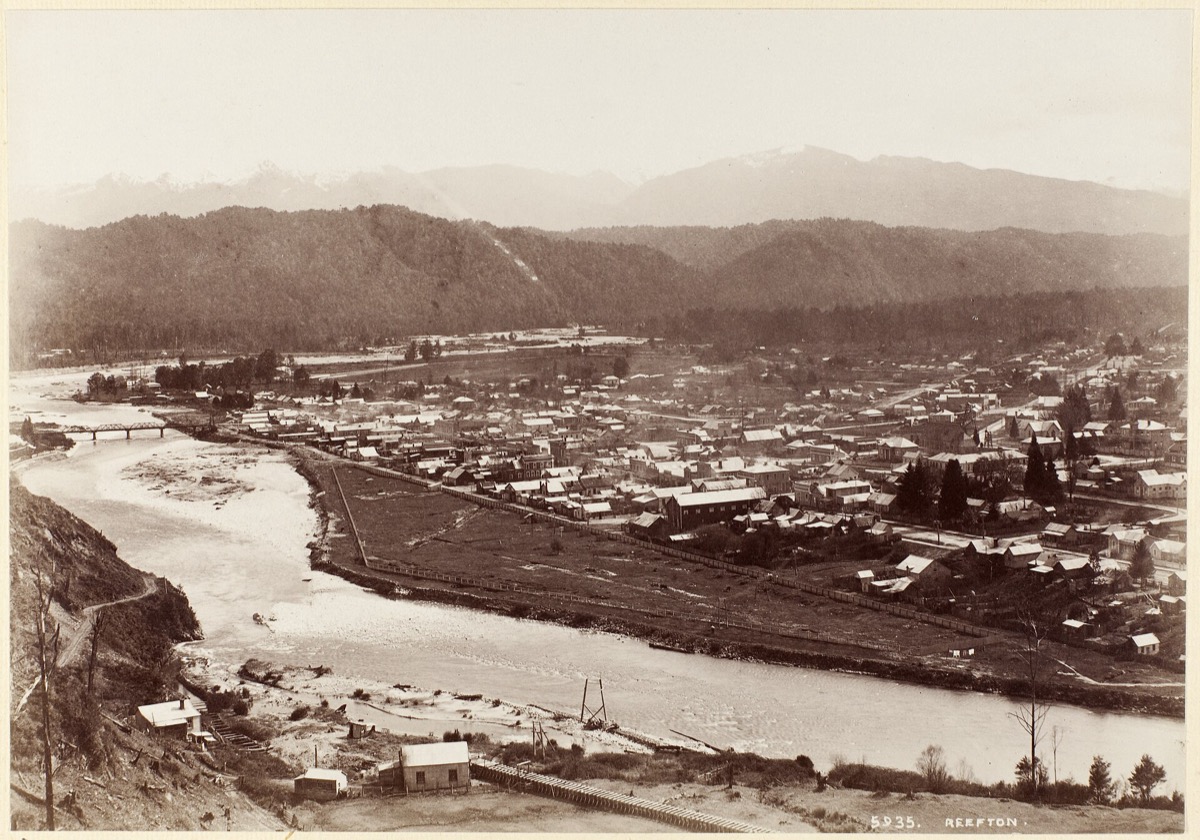
A New Zealand footnote: in August 1888, the West Coast town of Reefton switched on the first public electricity supply in the southern hemisphere. Heritage New Zealand ranks it among the earliest public supplies in the world, alongside London, New York and Vienna.
Haunting three: the electric car that died in 1912
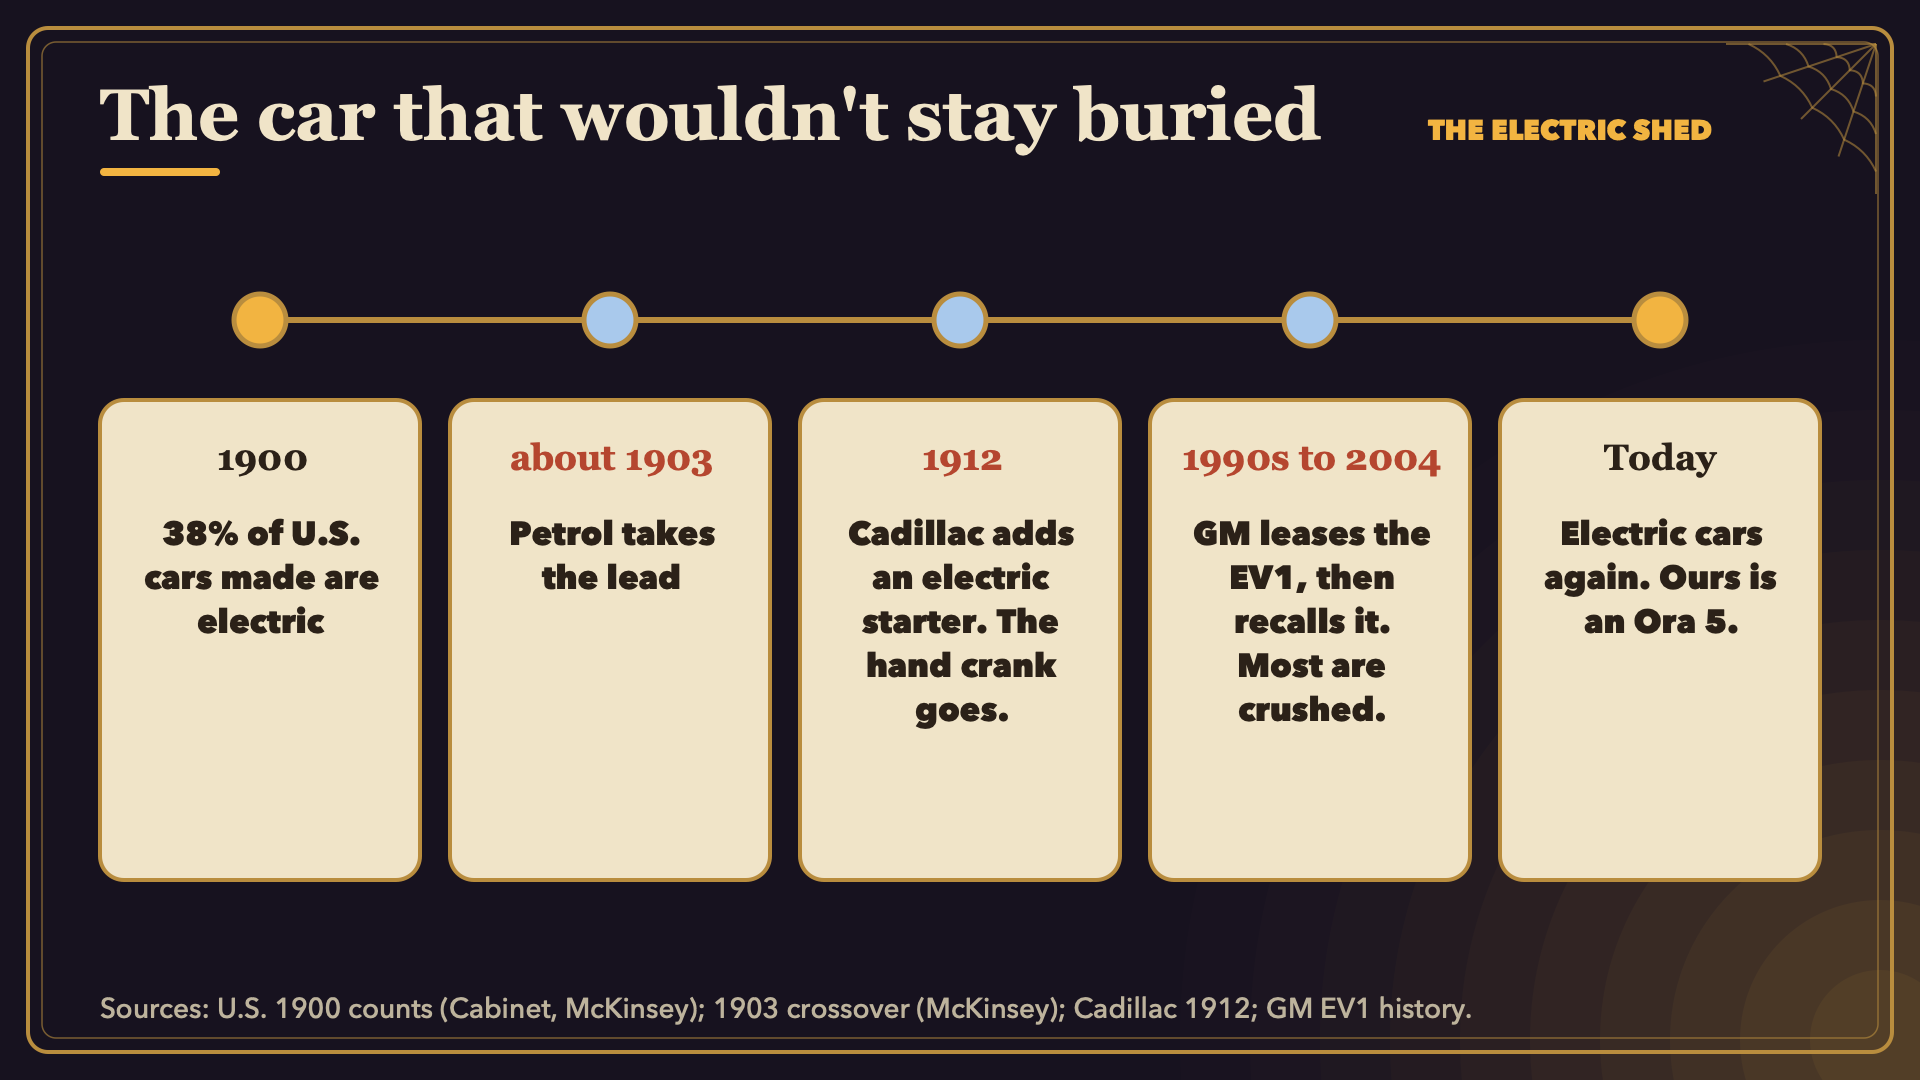
In 1900, 38% of the cars made in America were electric, not 38% of the cars on the road. They were quiet, clean, and nobody had to crank them by hand.
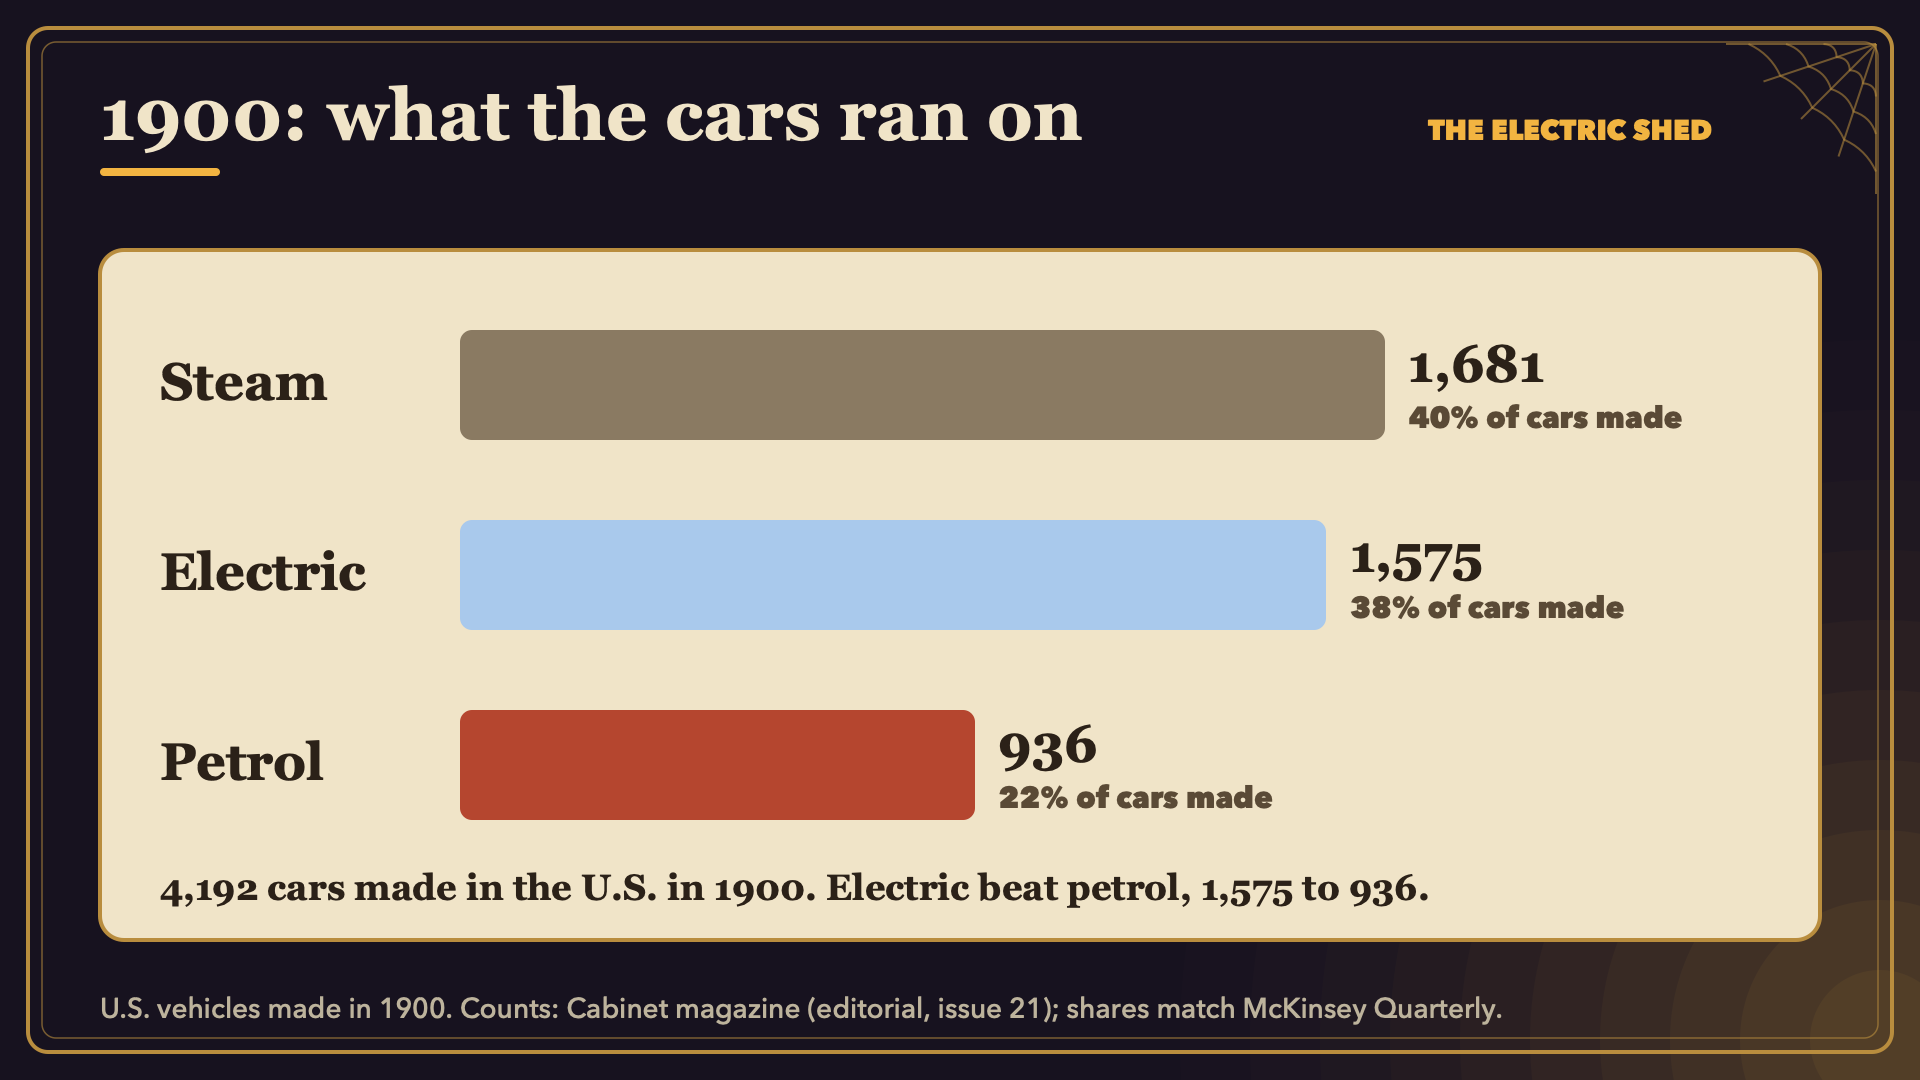
What killed them was not one thing. Petrol took the lead around 1903. In 1912, Cadillac added an electric starter to a petrol car, and the hand crank went. Roads got longer and petrol got cheap. GM leased the EV1 in the 1990s, then recalled it, and most were crushed. Today's electric cars are the sequel.
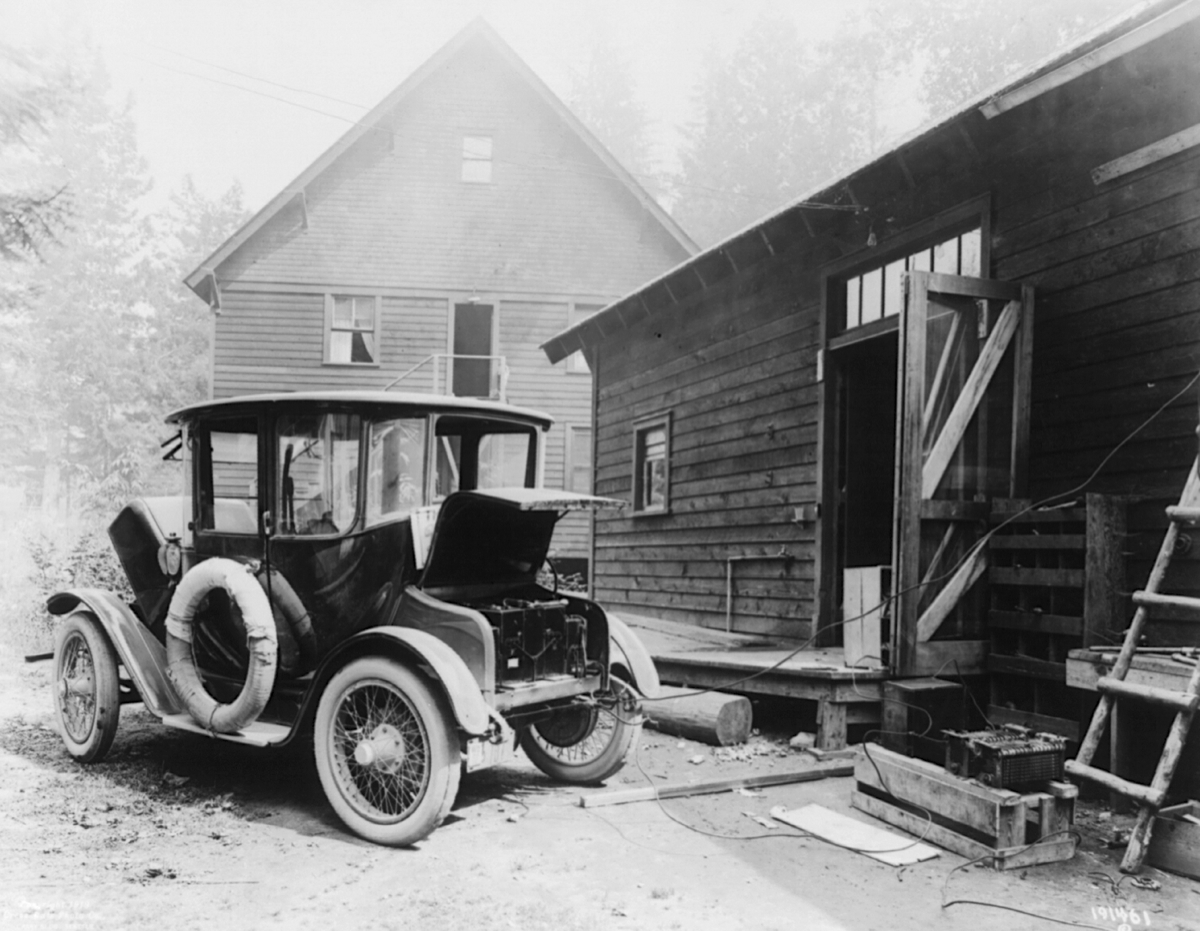
Ours is a GWM Ora 5, charged from a socket at home, much as that Detroit Electric was. For what that costs today, see what did that EV charge cost on Sweet Commute.
What to do with this
- Find your own floor: look at your smart meter or battery app between 1 and 5 am.
- Do the sum: watts × 8,760 ÷ 1,000 × your price.
- Switch off or unplug the old boxes you never use, and leave the fridge and router alone.
For more on where a home's power goes, see our home battery after nine months and a solar day with and without an EV.
Sources
- Nordhaus, W., Do Real-Output and Real-Wage Measures Capture Reality? The History of Lighting Suggests Not, Cowles Foundation Discussion Paper 1078 (1994). The five-hours-of-work and half-a-second figures are from secondary summaries of the paper.
- Heritage New Zealand, Reefton Power House Foundations.
- Leeds University, Domesticating electricity at Lotherton Hall; Field House Museum, Before the smoke alarm: fire safety in the 1800s.
- Cabinet magazine, editorial, issue 21 (1900 U.S. vehicle counts); McKinsey Quarterly, The 125th anniversary of the little engine that couldn't.
- MBIE household electricity consumption, via figure.nz; Northpower, citing EECA, on standby share.
- NRDC, Your smart TV may have insomnia, and its Xbox instant-on findings; Consumer NZ, Beware of the energy vampire: the humble garage fridge (2022).
- Energy Saving Trust (2012), via The Register; Sense.
- Our own data: the channel's dashboard, reading our Sigenergy system, 22 September – 21 October 2026, New Zealand. Prices in NZ$ unless stated.
Photos: Reefton, Muir & Moodie studio (public domain); Detroit Electric car, Cress-Dale Photo Co. (public domain); both Wikimedia Commons. Diagrams: The Electric Shed.